


Vingegaard, The Best Time Trialist Ever?

Jonas Vingegaard won the 110th Tour de France in July 2023, his 2nd in as many years. Last year’s race was fascinating and the battle between Team Jumbo-Visma, led by Vingegaard, and UAE Team Emirates, led by Tadej Pogačar, was dramatic at times, cementing a great rivalry that started with Pogačar’s maiden victory in 2020. All the way up to and through the Alps on stages 14 and 15 it was too close to call, with the gap standing at 10 seconds in Vingegaard’s favour leading into the individual time trial on Stage 16.
As is customary on the Tour, when a time trial is held the riders depart in reverse general classification order (the rider who has taken the least time to complete all proceeding stages goes last), with Pogačar the penultimate starter and Vingegaard closing proceedings. At the point they both set off, two minutes apart, the current fastest round the course was Wout van Aert, Vingegaard’s super domestique. Pogačar managed to beat van Aert’s time across the 22.4km route by 1 minute 13 seconds, an incredible feat. However, throughout the stage he would have known that Vingegaard was beating his pace through every checkpoint, finishing an astonishing 1 minute 38 seconds ahead of Pogačar’s time. He almost managed to close the departure gap and would have been able to see Pogačar up the road near the end of the stage.
With the Directeur Sportif’s of both teams claiming their leaders did as well as they anticipated I was curious as to why there was such a gulf between these two rivals, who up to this point had seemed so evenly matched. For further context, the year before, they had each beaten the other in a time trial during the Tour, the first to Pogačar, the second to Vingegaard, but during both, they were only separated by 8 seconds. I also wondered if there had ever been such a dominant time trial display in the Tour.
Historical Time Trials
I collated data from Pro Cycling Stats on the top 10 finishers from every Tour de France individual time trial from 1969 to Stage 16 of the 2023 edition.
Why did I start in 1969? That was the first year Eddy Merckx won the Tour. Given he is the most successful cyclist in the history of competitive cycling, acquiring the nickname “The Cannibal” for his inability to let others win, my thinking was if anyone was going to better Vingegaard’s performance it would be him. His 13 individual time trial victories, with a further three second places, is a testament to the nickname. In addition, I don’t hold a lot of confidence in the accuracy of timings from the earliest tours, thus this seemed like a clean place to break. It also gave me a dataset of 123 stages, plenty for this analysis.
Time trials are often called the “Race of Truth” as they are a demonstration of a cyclist’s ability vs the competition in the most standardised way, how fast can each rider get round the same circuit by themselves. However, not all time trials are alike. In this dataset, the shortest time trial was 6km whilst the longest was 87.5km, and that says nothing about the volume of ascending and descending required on each course. Due to this, it would be inappropriate to compare the difference in times of riders between stages, however, by looking at the difference in the speed of the top 10 rider’s in completing a stage, you can compare different stages across time.
First, let’s remind ourselves how Stage 16 finished (Table 1).

As you can see, Vingegaard was the only rider to break 40km/h and was over 4km/h faster than Mads Pedersen and David Gaudu in 9th and 10th (he was over 10km/h faster than Alexis Renard who finished last in 156th).
So how does this difference in speed between 1st place and the rest of the top 10 compare to the other time trials in the dataset?

Let me explain what you’re looking at in Graph 1. The x-axis is the position within the top 10 of the time trial and the y-axis is the relative speed of the winner vs the rider who finished in that position. As such, all the lines for the dataset start at 0% for position 1. This is quite a messy graph, so following I will highlight certain past time trials to compare to Vingegaard’s 2023 stage 16 victory. For now, the first thing that should be quite striking is the blue line at the top, which is Vingegaard’s victory. His comparative difference to every position in the top 10 of this race is the best within the dataset. In no other stage does the winner have such a commanding lead over every other position within the top 10.
To analyse the data further we can look at the standard deviation of Vingegaard’s results compared to the dataset. To briefly talk through Table 2 below:
Each column responds to the position of the rider within the top 10.
2023 (16 V) is the difference in speed of 1st to the rest of the top 10 from Table 1 for Vingegaard’s victory, written in decimal rather than percentage terms.
Mean is the average difference in speed between the winner and each position of the top 10 in the dataset.
Population SD is the relative difference in speed between the winner and each position of the top 10 within the dataset that would equate to one standard deviation from the mean.
Vingegaard SD is how many standard deviations away from the mean his 2023 stage 16 victory, is relative to each position.
The final row, Chebyshev’s theorem, is slightly more complex and I won’t go into detail about how the theorem works, but instead describe what it says about Vingegaard’s result. As this data is non-normal, we use Chebyshev’s theorem to estimate the minimum proportion of a distribution that would fall within a set number of standard deviations from the mean. For column 2 this means that 92.1% of results would fall within ±3.556 standard deviations of the mean, and so Vingegaard’s result is in the remaining 7.9%. For column 3 this would mean 95.9% of results fall within ±4.936 standard deviations of the mean, so Vingegaard’s result is in the remaining 4.1%, and so on.
Both of Vingegaard’s results vs the 3rd and 4th riders are above 95%, a common threshold for statistical significance within scientific research. A limitation of Chebyshev’s theorem is that it only tells you a minimum proportion of results which fit within that ± standard deviation, and in reality, it could be larger. Given every one of Vingegaard’s results is within a couple of percentage points from the 95% statistical significance level, many more positions than just his relative speed to 3rd and 4th place might cross that threshold.

Duelling princes
The first comparison I want to make is with his main competitor for stage 16 Tadej Pogačar. It was mentioned during commentary that one of the reasons for the discrepancy was that Pogačar might not have been feeling 100%, with it not being his day. Deep into the third week of a grand tour, it is probable that any rider could be feeling the effects of the preceding weeks’ racing. This would have been potentially further compounded by the lack of racing and training he had undertaken since he crashed in April 2023, fracturing his wrist. However, the data doesn’t support this (Graph 2).
Imagine Vingegaard disappeared from stage 16 and Pogačar won, beating van Aert by 1 minute 13 seconds. If you run the top 10 comparison again (2nd to 11th in real life) Pogačar has a very dominant performance, achieving higher than mean speeds for the dataset (the smooth red line) compared to every position. On any normal race day this would have been a resounding victory, so for Vingegaard to effectively double the relative speed of Pogačar to each position is astounding.

The Cannibal
As mentioned, the greatest cyclist to grace the sport is Eddy Merckx, who among his many achievements is tied on five Tour de France wins (with Jacques Anquetil, Bernard Hinault & Miguel Indurain) and 34 Tour de France stage wins (with Mark Cavendish). He would regularly beat competitors on mountains and in sprints, picking up their respective jerseys on multiple occasions, as well as winning the combativity award four times. He also set a new hour record of 49.431km in 1972 which would stand for 12 years. This was a man who could race any rider on any type of stage, and this translates to time trials as well. So how dominant was he over the competition during his years on the tour?
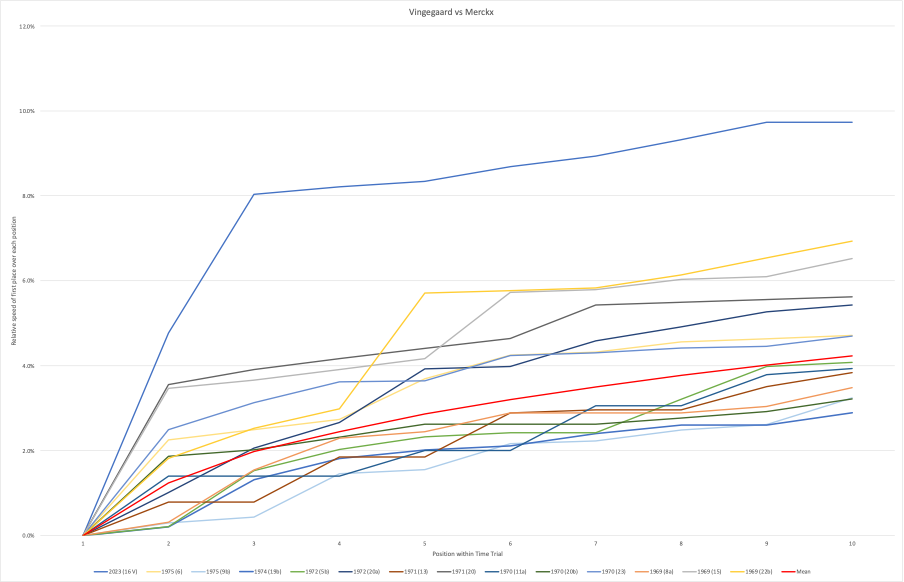
Once again, in Graph 3 the smooth red line is the mean relative difference between 1st and the rest of the top ten within the dataset. Of Merckx’s 13 wins, he has seven that generally fall below the mean and six that are above the mean, a typical grouping. Even his dominant wins in 1969 (stages 15 and 22b) and 1971 (stage 20) look trivial and rather pedestrian compared to Vingegaard. It should also be noted that Merckx tested positive for banned substances three times in his career, including being expelled from the Giro d’Italia in 1969 while leading the race.
Champion of Champions
Extraordinary claims require extraordinary evidence, and as a disclaimer, I have no evidence to suggest Jonas Vingegaard has in any way used performance-enhancing drugs at any stage of his career, not least in 2023 when he recorded this victory. This is just a singular data point, and as such any conclusions drawn should be taken with a healthy dose of scepticism. The circumstantial case is in no way as clear as that of Usain Bolt. But, in a sport with as chequered a past as cycling it would be naïve to dismiss out of hand.
I wanted to make one final comparison to any stage in the dataset where the victor has either failed a drug test at some point in their career, been disqualified for drugs, or post-retirement has admitted to taking drugs during their career. That was 59 out of the 123 stages in the dataset, which is telling. That doesn’t include former tour winners Bradley Wiggins or Chris Froome, each with two first places during time trials in the early 2010’s, who both have doping allegations levelled against them. This includes a failed drugs test in Froome’s case. However, Froome was exonerated by the UCI and no further action was taken against Wiggins. I’m not sure how beneficial it would be to see a comparison of Vingegaard to 59/63 other stages so I will leave it at that.
Instead, I’m going to compare Vingegaard’s result to those of three former Tour champions who competed during the heyday of doped cycling. Two of these champions, Bernard Hinault and Greg LeMond are, as far as we know, clean, having never failed a drug test, whilst the other, Lance Armstrong, had his titles stripped and reputation destroyed when he admitted to using performance-enhancing drugs.
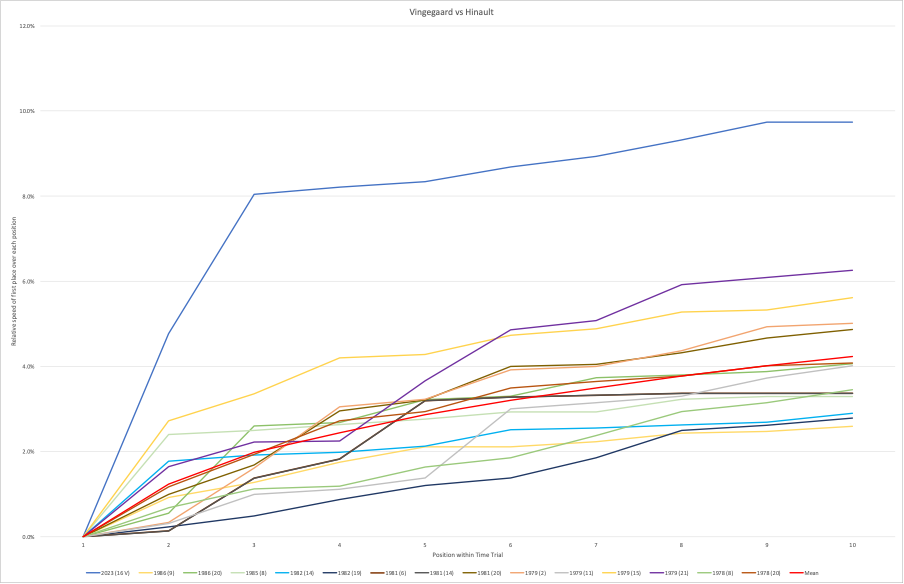


Hinault’s results are in Graph 4, LeMond’s are in Graph 5, and Armstrong’s are in Graph 6. Like Merckx, we can see an even clustering above and below the red mean line for Hinault and LeMond. In contrast, whilst Armstrong’s victories are split five above and four below, the ones below track much closer to the mean. Even so, during these races where a large proportion of the peloton were reportedly using drugs, Armstrong’s best results are broadly like those of Hinault, despite his rampant usage. If the pattern of a doped winner and non-doped winners within a doped peloton match closely we could assume that a non-doped winner in a non-doped peloton would also fit within these bounds. In a 2023 field that is supposedly majority clean, to have a result generated so far out of the norm is extraordinary.
Conclusion
The beauty of sport is its unpredictability. Whether it is an underdog toppling a giant, or witnessing an athletic feat once perceived to be unthinkable, this drama is what captivates fans of all sports around the world. On occasion, athletes perform extraordinarily well, surpassing the competition of the day, and sometimes even all competitors who have come before them. With that in mind, I wanted to highlight three incredible records, coincidently all from track and field, where the new record blew away the previous one.
At the Mexico Summer Olympics in 1968, Bob Beamon was the favourite for the Long Jump gold medal, having won 22 out of 23 meets he had entered that year. No one was quite ready for how dominant he would be. During the final on his first jump, he achieved a distance of 8.90m, bettering the previous world record by 55cm. Before that jump the record had changed 13 times since 1901, with the largest increase being 15cm. This 5% delta on the previous record was enough for him to maintain the world record for 23 years, until Mike Powell jumped 8.95m in 1991. Beamon’s record is still the Olympic record and the second farthest wind-legal jump in history. Since then, the adjective “Beamonesque” has come into use to describe spectacular feats.
On July 20, 1984, Uwe Hohn set an eternal record, that many believe will never be beaten. On that day in Berlin, he threw a Javelin 104.80m to win gold at the Olympic Day of Athletics competition. He is the first and only person to throw a Javelin over 100m and beat the previous record of 99.72m (5% improvement) set by Tom Petranoff a year earlier. This throw landed near the end of the field and came very close to a High Jump mat that had been presumed to be at a safe distance. In 1986 the rules of the sport were changed, although contrary to popular belief, not because of Hohn’s impressive feat. From then on, a competition javelin was altered to add mass and move the centre of gravity forward to decrease the number of flat landings, which had been leading to invalid throws and protests by competitors. Since the change, Honh’s record lost its official status, and the current holder is Jan Železný with a throw of 98.48m set in 1996. Using a modern Javelin, it is unlikely anyone will ever match Hohn’s record.
Finally, we turn to the Triple Jump and the current world record holder Jonathan Edwards. During the 1995 World Championships, he broke the record twice in the same meet. His first jump of 18.16m meant he was the first athlete to legally pass the 18m barrier, and 20 minutes later his second jump of 18.29m made him the first to jump over 60ft. Whilst his second jump was only a 2% improvement on the previous record of 17.97m, since that day, only Christian Taylor in 2015 has managed to beat Edward’s first attempt, but he was still 8cm short of the record.
Uwe Hohn competed for East Germany, a country with a known state-sponsored performance-enhancing drug programme that spanned multiple sports. I couldn’t find any direct evidence that he had personally used drugs, although I did find a source claiming documents from the East German archives indicated Hohn consumed Oral Turinabol, an anabolic steroid, in 1985. There is no suggestion either Beamon’s or Edwards’ records were aided by the use of drugs, they were just fantastic displays of athleticism.
Since 2009, no winner of a Tour de France Time Trial has, in the public knowledge, taken performance-enhancing drugs. I sincerely hope this is a case of cycling having cleaned up its act. Tempering hope is reality though, and drug enforcement in professional sport is a game of cat and mouse, where many of those 59 drug-enhanced time trial victors were caught well after they had ridden over the finish line and onto the podium, with some never “caught” at all.
It is worth restating though that I have no evidence Jonas Vingegaard has ever used performance-enhancing drugs and this Beamonesque performance is one outstanding and outlying observation. Should he look to defend his yellow jersey this coming July, a tall ask given his horrific crash in April and subsequent lack of adequate preparation, I will be excited to see if he can put in a similar dominating performance on stage 21 when he crosses the line in Nice, perhaps sealing his three-peat.